| Home | Since scientists and government officials
realized that El Niņo was a force that had to be
understood and reckoned with, a tremendous effort has
been expended to make El Niņo predictable and easy to
forecast. Satellites have been placed into orbit and the
globe has been blanketed with monitoring devices to reach
those ends. Joint U.S./French TOPEX/Poseidon satellite
In August 1992, TOPEX/Poseidon was launched into Earth's orbit by an Ariane 42P rocket from the European Space Agency's Space Center located in Kourou, French Guinea -- the first launch of a NASA payload from this site. From its orbit 1,336 kilometers (830 miles) above the Earth's surface, TOPEX/Poseidon measures sea level along the same path every 10 days using the dual frequency altimeter developed by NASA and the CNES single frequency solid-state altimeter. This information is used to relate changes in ocean currents with atmospheric and climate patterns. Check the most recent sea level readings. The Tropical Atmosphere Ocean Array
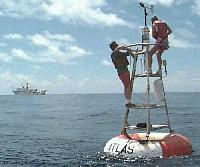
The TAO array consists of approximately 70 ATLAS buoys and current meter mooring sites in the tropical Pacific Ocean, telemetering oceanographic and meteorological data in real-time via the Argos satellite system. Designed to improve detection, understanding, and prediction of El Niņo, TAO is a major component of the global climate observing system. The array is presently supported by an international consortium, involving cooperation between the United States, France, Japan, Korea and Taiwan. Pacific El Niņo-Southern Oscillation Applications Center Pilot Project In the early 1970s, the University of Hawaii Sea Level Center began installing tide gauges in the tropical Pacific to study the potential of sea level observations for ocean monitoring. Using data from this network of gauges, Professor Klaus Wyrtki presented the first detailed descriptions of the oceanic ENSO cycle in the tropical Pacific. Further development of this program over the intervening years has resulted in the Indo-Pacific Sea Level Network, presently the largest open ocean sea level network in the world operated by a single group. Gathering clues of past El Niņos In addition to running truckloads of data through high speed computers, scientists continue to try to figure out what the past looked like by piecing together bits of historical evidence from many different sources, including:
Another way scientists can make guesses as to what happened in the past is by looking at coral samples and tree rings, which by their annual growth patterns can potentially provide clues to El Niņos of past centuries. |
| What is El Niņo? | |
| Measuring El Niņo | |
| Comparing El Niņos | |
| Global Effects | |
| El Niņo to La Niņa | |
| Further Reading | |
| The Team | |
 |
|
| This page
has been visited times since 25 June 1998 |
|
| Web space
kindly provided by |
|
| Best viewed
with at 800x600 High Colour (32-bit) |
|

